Studio
The studio command launches a web-based dashboard for browsing evaluation runs, inspecting individual test results, and reviewing scores. It shows both local runs and runs synced from a remote results repository.
agentv studioStudio auto-discovers run workspaces from .agentv/results/runs/ in the current directory and opens at http://localhost:3117.
You can also point it at a specific run workspace or index.jsonl manifest:
agentv studio .agentv/results/runs/2026-03-30T11-45-56-989Z/index.jsonl# oragentv studio .agentv/results/runs/2026-03-30T11-45-56-989ZOptions
Section titled “Options”| Option | Description |
|---|---|
--port, -p | Port to listen on (flag > PORT env var > 3117) |
--dir, -d | Working directory (default: current directory) |
--multi | Launch in multi-project dashboard mode (deprecated; use auto-detect or --single) |
--single | Force single-project dashboard mode |
--add <path> | Register a project by path |
--remove <id> | Unregister a project by ID |
--discover <path> | Scan a directory tree for repos with .agentv/ |
Features
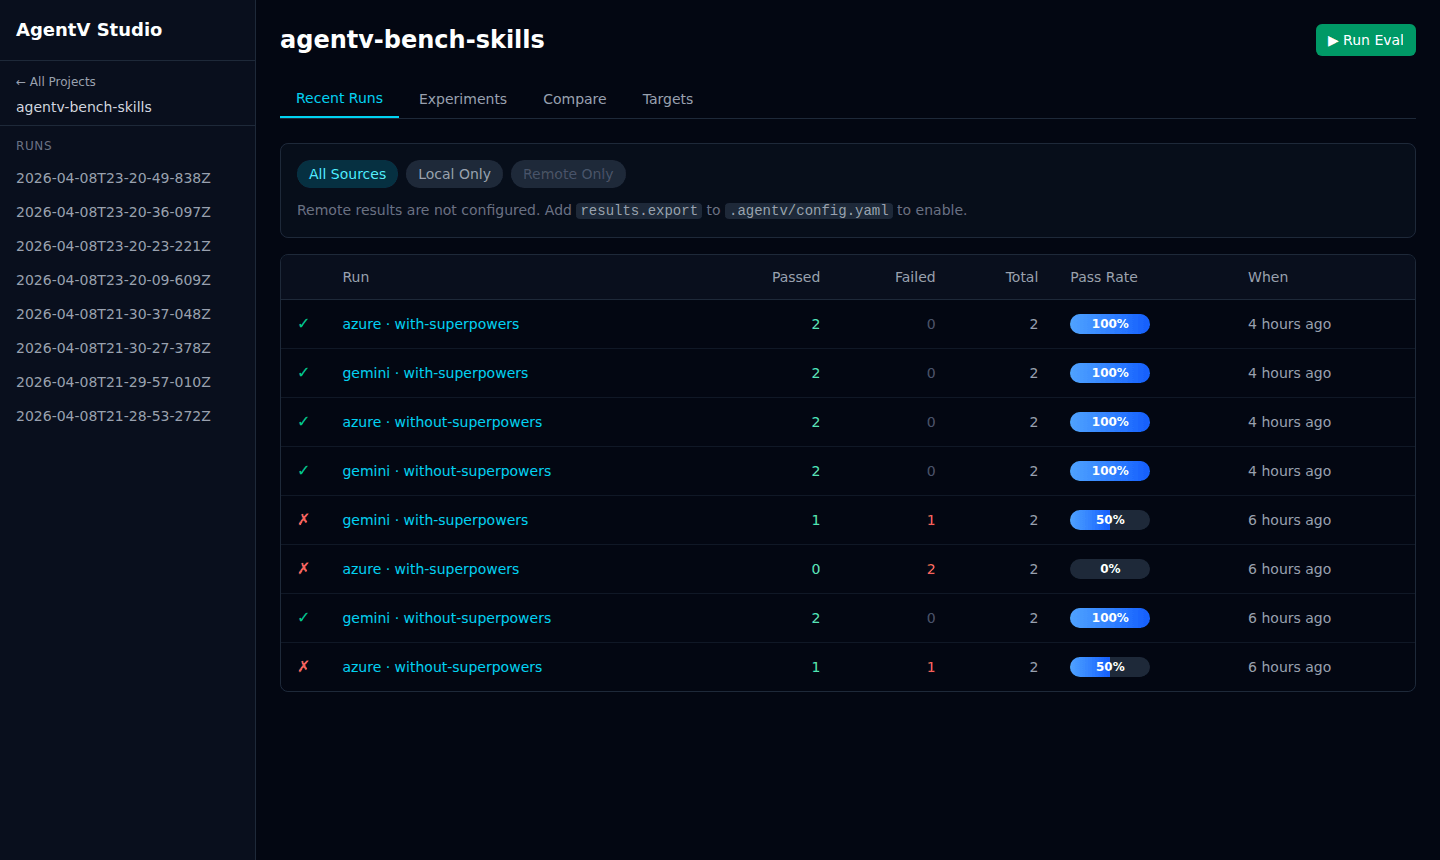
Section titled “Features”- Recent Runs — table of all evaluation runs with source badge (
local/remote), target, experiment, timestamp, test count, pass rate, and mean score - Experiments — group and compare runs by experiment name
- Targets — group runs by target (model/agent)
- Run Detail — drill into a run to see per-test results, scores, and evaluator output
- Human Review — add feedback annotations to individual test results
- Compare — two modes: an aggregated experiment × target matrix, and a per-run view for selecting individual runs to compare side-by-side with optional retroactive tags
- Remote Results — sync and browse runs pushed from other machines or CI (see Remote Results)
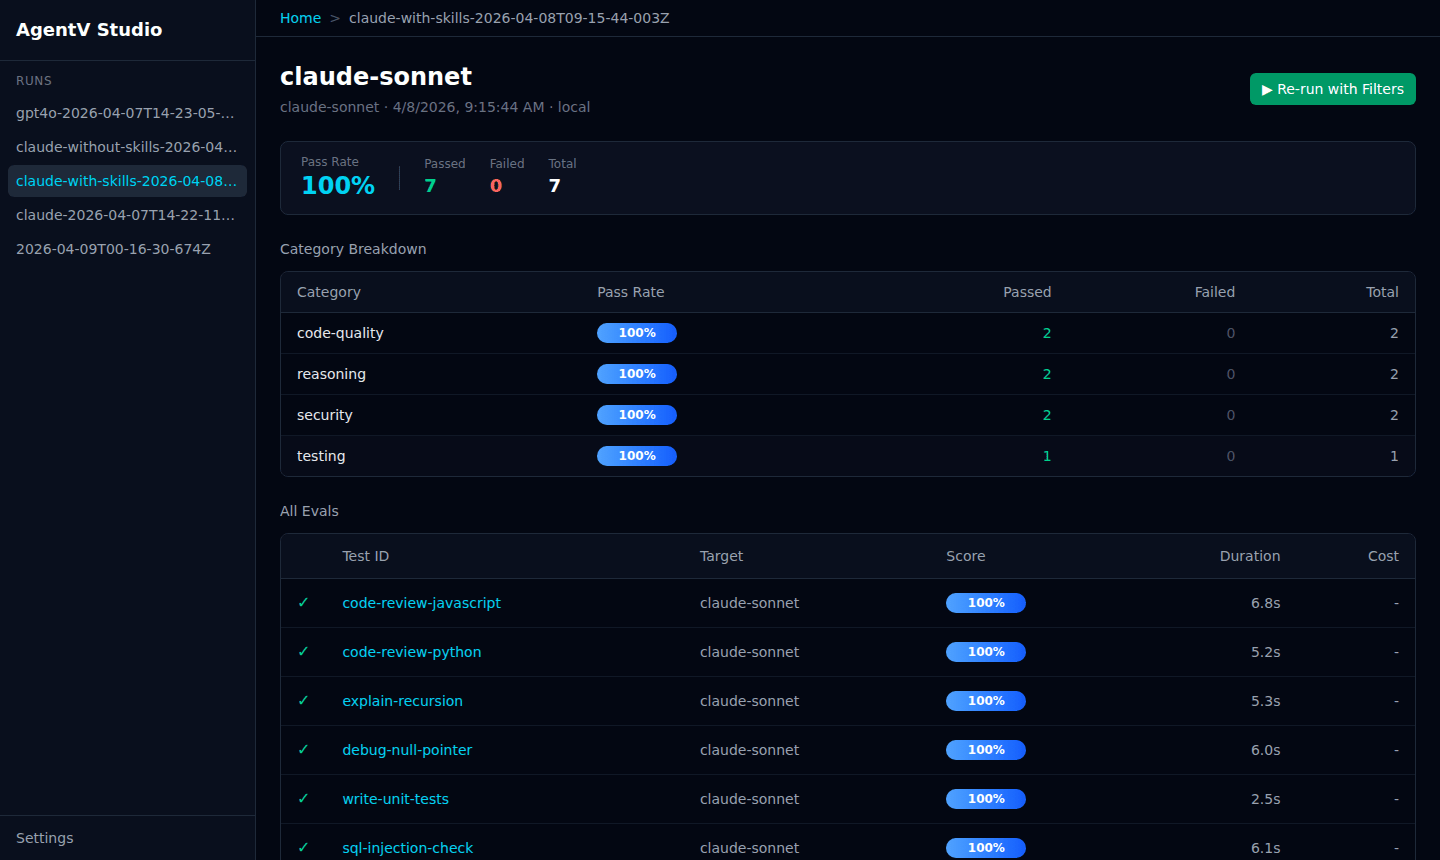
Run Detail
Section titled “Run Detail”Click any run to see a breakdown by suite, per-test scores, target, duration, and cost. The source label (local or remote) tells you where the run came from.
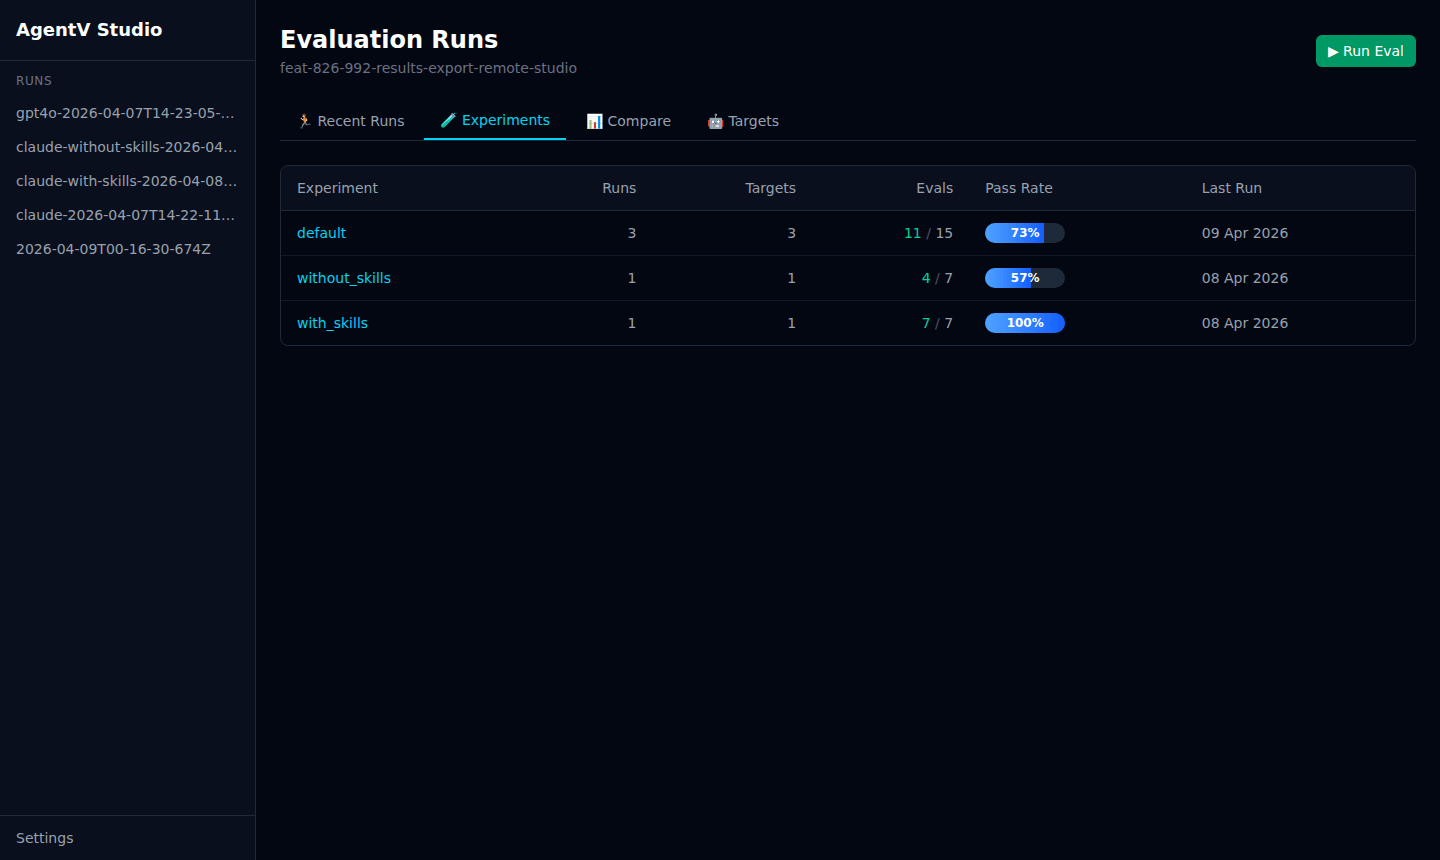
Experiments
Section titled “Experiments”The Experiments tab groups runs by experiment name so you can compare the impact of changes — for example, with_skills vs without_skills.
Compare
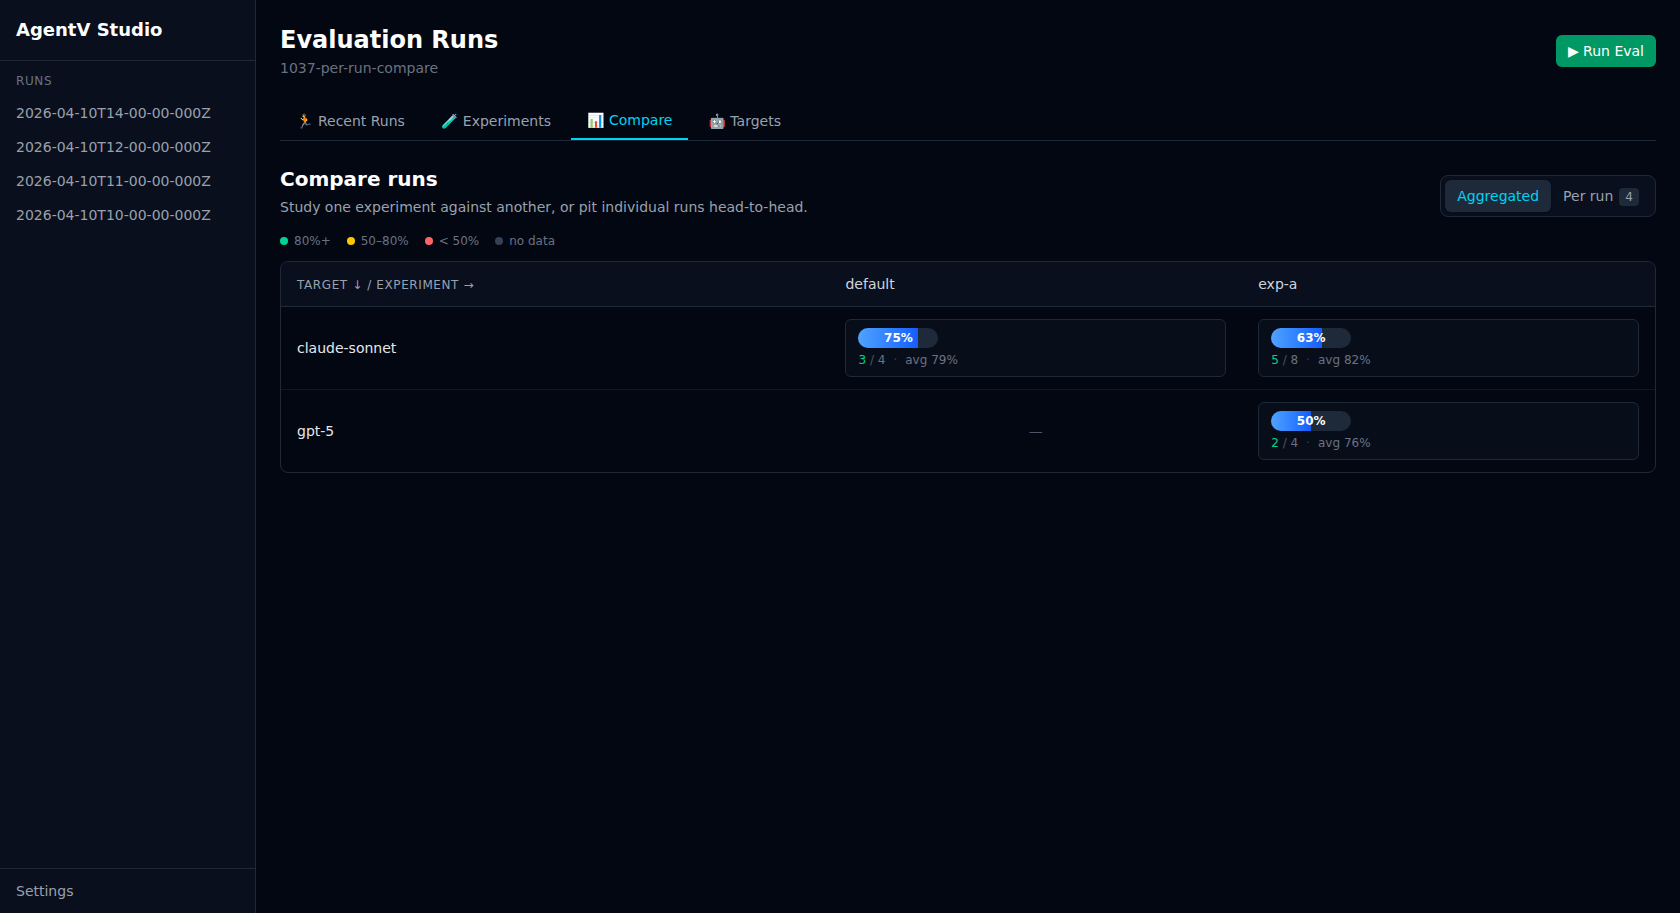
Section titled “Compare”The Compare tab has two modes: Aggregated for the classic experiment × target matrix, and Per run for selecting individual runs and pitting them side-by-side. Toggle between them from the mode switch on the right of the masthead.
Aggregated matrix
Section titled “Aggregated matrix”The default view shows a cross-experiment, cross-target performance matrix. Numbers are colour-coded by pass rate — green (80%+), amber (50–80%), red (below 50%) — and each cell shows passed/total and the mean score. Click any cell to expand the per-test-case breakdown.
Run the same eval against multiple providers or experiment variants, then open the Compare tab:
agentv eval my.EVAL.yaml --target azure --experiment baselineagentv eval my.EVAL.yaml --target azure --experiment with-cachingagentv eval my.EVAL.yaml --target gemini --experiment baselineagentv eval my.EVAL.yaml --target gemini --experiment with-cachingagentv studio # Compare tab shows 2x2 matrixPer-run comparison
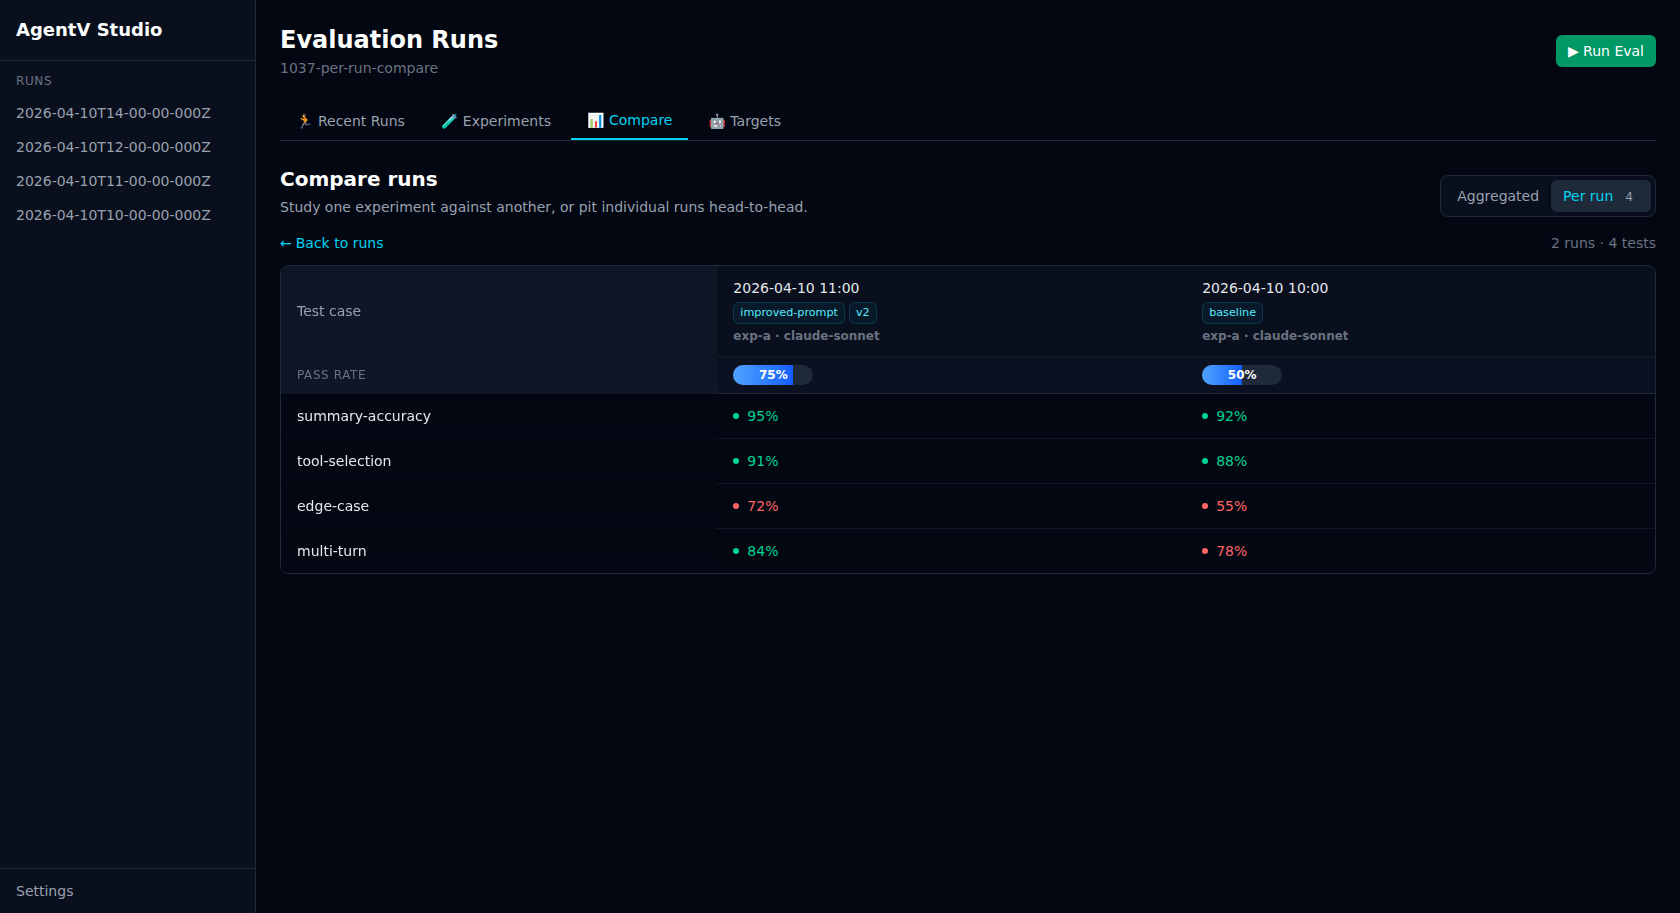
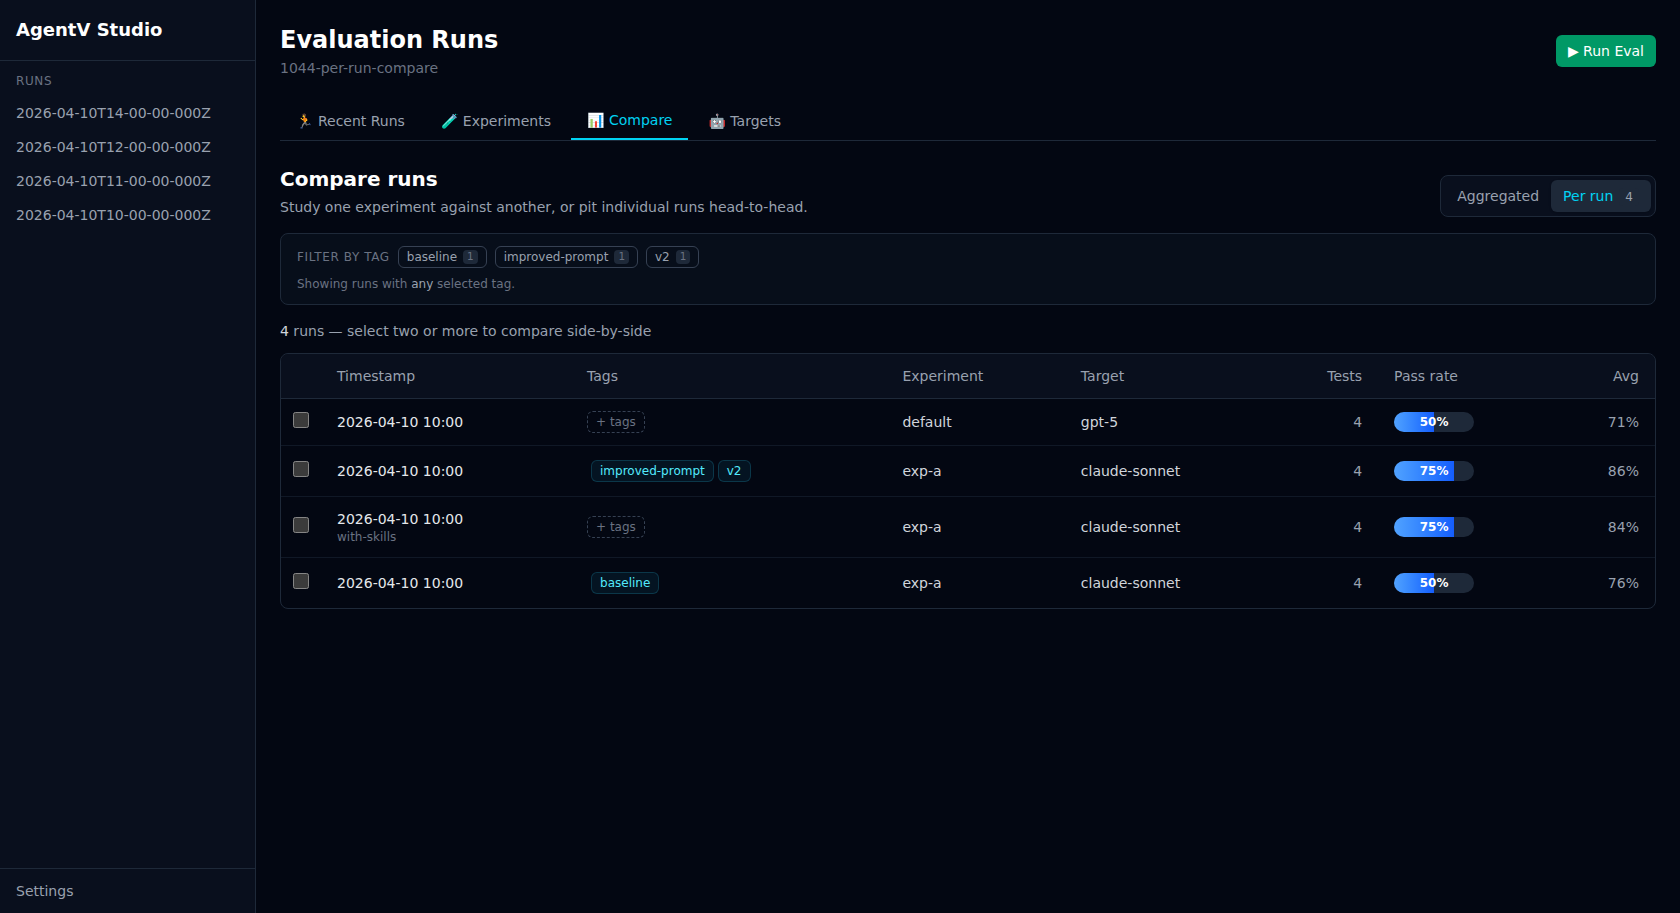
Section titled “Per-run comparison”Running the same (experiment, target) twice no longer collapses into a single cell. Switch to Per run mode to see every run as its own row, select two or more, and compare them head-to-head.
Use per-run mode when you want to:
- Compare back-to-back runs of the same agent + eval after a prompt or parameter tweak
- Pit a fresh run against a tagged baseline without touching the eval YAML
- Debug flakiness by inspecting two identical-configuration runs side-by-side
Select 2+ rows with the checkboxes and click the sticky Compare N action to open the side-by-side view. Column headers show the run’s timestamp, with any assigned tags as chips below it. The per-test breakdown reuses the same scoring and colour tones as the aggregated matrix.
Retroactive tags
Section titled “Retroactive tags”Click any row’s Tags cell to tag a run after the fact. Each run can carry multiple free-form tags (max 20, up to 60 characters each); tags are stored in a tags.json sidecar next to index.jsonl in the run workspace, so they’re mutable, non-destructive, and won’t touch your eval YAML or run manifest. The chip editor supports Enter/comma to commit a new tag, Backspace to remove the last chip, and Clear all to remove every tag (deletes the sidecar). Remote runs are read-only.
Use tags to annotate ad-hoc variants, experiment cross-cuts, or status flags you didn’t plan for up front — baseline, v2-prompt, slow, after-retry-fix, regression, etc. Unlike experiment — which groups runs and is baked into the JSONL at eval-run time — tags are mutable, multi-valued, and never touch the original run data.
Filtering by tag
Section titled “Filtering by tag”Once runs are tagged, a chip row appears above the compare view listing every distinct tag with a usage count. Click a chip to narrow both the aggregated matrix and the per-run table to runs carrying at least one of the selected tags (OR semantics — clicking a second chip widens the set). A Clear link resets the filter, and filter selections persist as you switch between Aggregated and Per-run modes.
The same filter is available to API consumers via GET /api/compare?tags=baseline,v2-prompt, which returns only the cells and runs whose tags intersect the query.
Benchmarks Dashboard
Section titled “Benchmarks Dashboard”By default, Studio shows results for the current directory. Register multiple benchmark repos to view them from a single dashboard.
Registering Benchmarks
Section titled “Registering Benchmarks”Register benchmark repos one at a time:
agentv studio --add /path/to/my-evalsagentv studio --add /path/to/other-evalsEach path must contain a .agentv/ directory. Registered benchmarks are stored in ~/.agentv/projects.yaml.
Auto-Discovery
Section titled “Auto-Discovery”Scan a parent directory to find and register all benchmark repos:
agentv studio --discover /path/to/reposThis recursively searches (up to 2 levels deep) for directories containing .agentv/ and registers them.
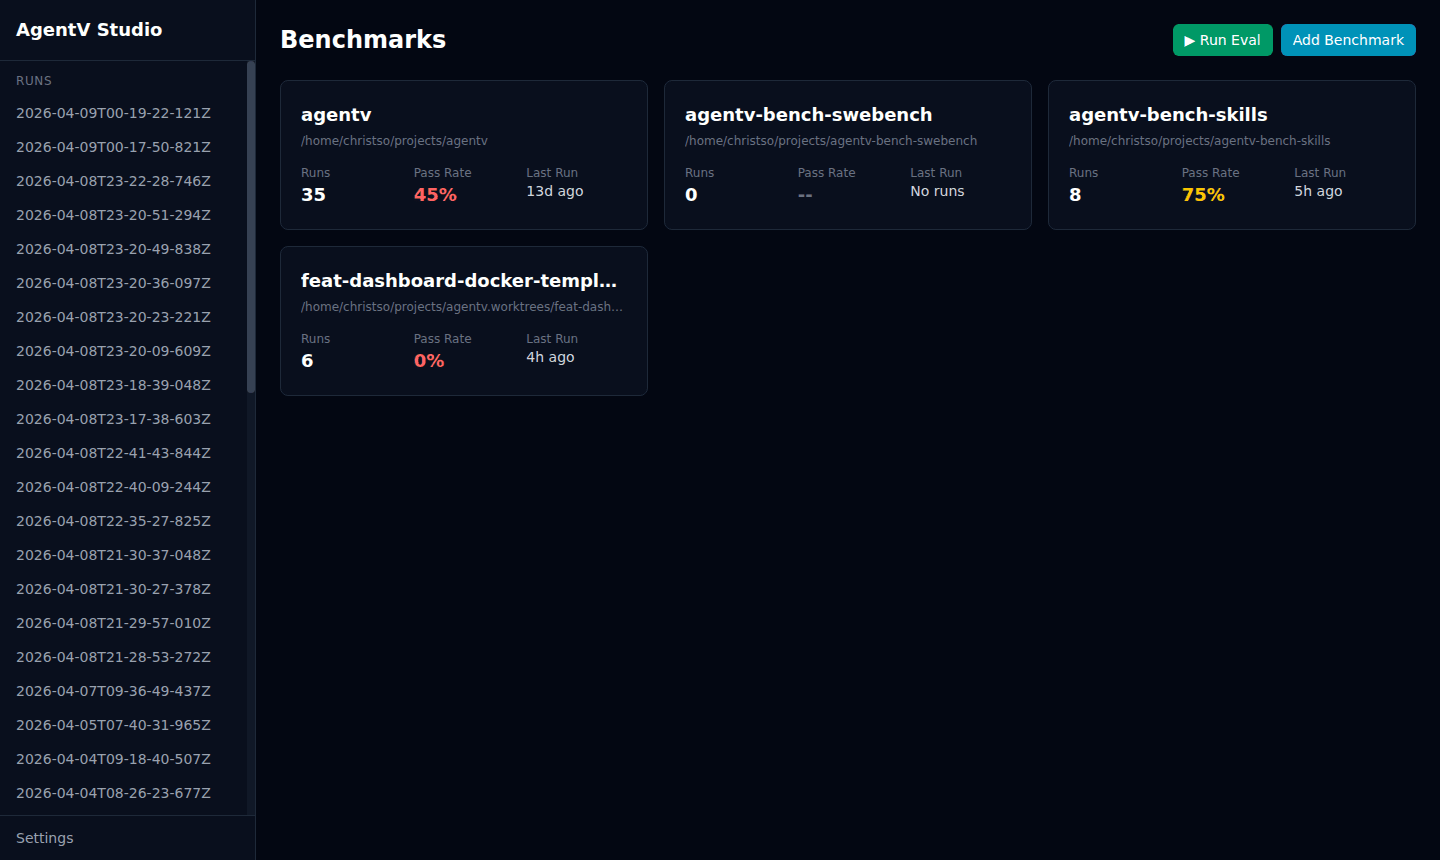
Launching the Dashboard
Section titled “Launching the Dashboard”Studio auto-detects the mode based on how many benchmarks are registered:
0or1registered: single-project view2+registered: Benchmarks dashboard
agentv studio # auto-detectsagentv studio --single # force single-project viewThe landing page shows a card for each benchmark with run count, pass rate, and last run time.
Removing a Benchmark
Section titled “Removing a Benchmark”Unregister by its ID:
agentv studio --remove my-evalsIDs are derived from the directory name (e.g., /home/user/repos/my-evals becomes my-evals).
Remote Results
Section titled “Remote Results”Studio can display runs pushed to a remote git repository by other machines or CI — alongside your local runs. Each run in the list carries a source badge: local (green) or remote (amber).
Configuration
Section titled “Configuration”Add a results.export block to .agentv/config.yaml:
results: export: repo: EntityProcess/agentv-evals # GitHub repo (owner/repo or full URL) path: runs # Directory within the repo auto_push: true # Push automatically after every eval run branch_prefix: eval-results # Branch naming prefix (default: eval-results)With auto_push: true, every agentv eval run or agentv pipeline bench automatically creates a draft PR in the configured repo with a structured results table.
Authentication
Section titled “Authentication”Uses gh CLI and git credentials already configured on the machine. If authentication is missing, AgentV warns and skips the export — the eval run itself is never blocked.
Syncing in Studio
Section titled “Syncing in Studio”Once configured, Studio fetches remote runs on load. Use the Sync Remote Results button in the source toolbar to pull the latest. The toolbar also shows when results were last synced and the configured repo.
Use the All Sources / Local Only / Remote Only filter to narrow the run list by origin.